Apr 15, 2020
Apr 15, 2020
We're Hiring
Join us and build the next generation AI stack - including silicon, hardware and software - the worldwide standard for AI compute
Join our teamGraphcore has released a new application analysis tool as part of the Poplar® SDK development environment that builds upon flexibility and ease of use when developing for the IPU processor. The PopVision™ Graph Analyser is the first in Graphcore’s PopVision™ family of analysis tools that help users gain a deep understanding of how their applications are performing and utilising the IPU.
With its user-friendly graphical interface and state of the art analysis capabilities for understanding machine learning models developed in TensorFlow, PyTorch and PopART, the PopVision Graph Analyser gives users a more fundamental understanding of their code’s inner workings than that provided by other platforms. By integrating directly with the internal profiling support of our Poplar Graph Engine and Compiler, we now provide all users of Graphcore technology with the ability to build better applications.
Graphcore is committed to making machine learning applications and models quicker and easier to develop and deploy from existing frameworks. We are enabling the next generation of machine learning by giving users the ability to program directly at the hardware level. The PopVision Graph Analyser complements this approach, reflecting our commitment to providing the simplest and easiest to use development environment for our technology.
PopVision™ Graph Analyser Key Features
Here is a quick summary of the main features included in our new PopVision Graph Analyser. Below we’ll go into more detail and explain how each feature can be used when working with IPUs and Poplar.
Summary Report: View essential program information
Memory Report: Analyse program memory consumption and layout on one or multiple IPUs
Liveness Report: Explore temporary peaks in memory and their impact
Execution Trace Report: View program execution
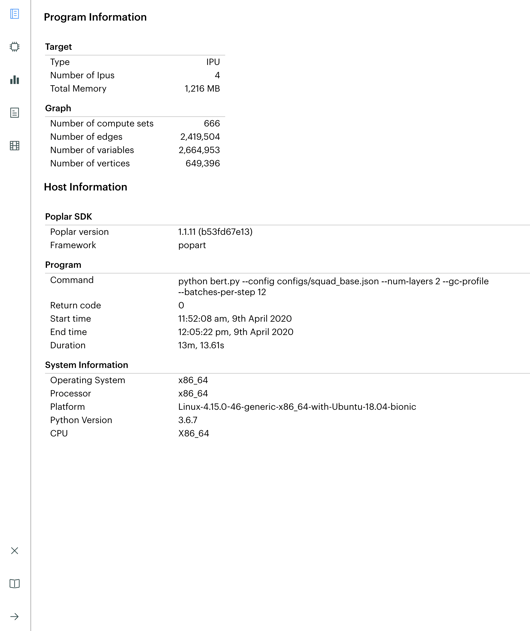
Summary Report
The first report within the PopVision Graph Analyser is the Summary Report. This summarises the program that has been compiled, including type of processor used, graph size, host information and program command line.
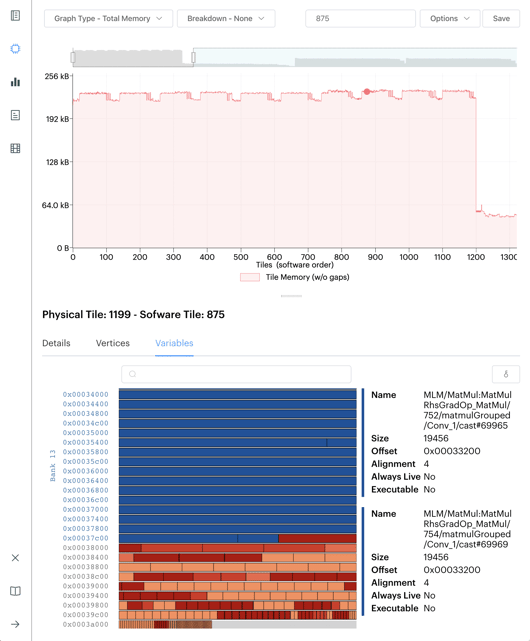
Memory Report
The Memory Report shows how a program uses memory on the IPU. The interactive graph displays how memory has been allocated to each of the tiles and what each memory location within a tile has been used for (e.g. a convolution). Selecting a single tile from the graph will provide detailed information on the memory usage of that tile.
The interactive graph allows you to zoom and scroll the plot to focus on a subset of tiles. The zoom feature is particularly useful for more complex graphs of large-scale, multi-IPU models.
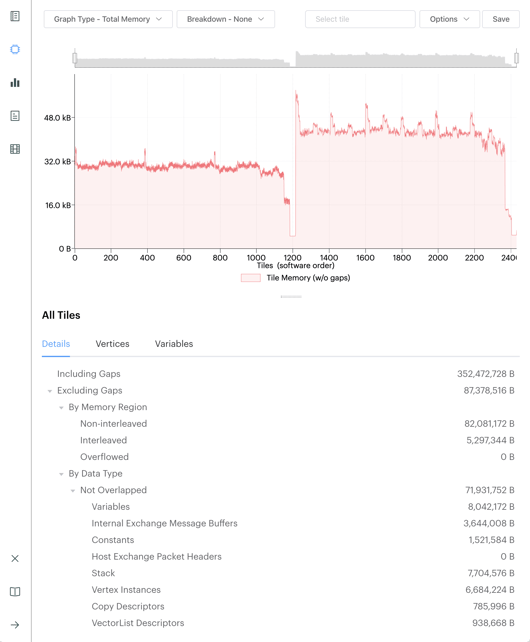
Memory allocation per tile is colour-coded by variable type (code, weight, activations and other tensors). By filtering the view, just the variables for a specific operation, such as a convolution or a layer, can be displayed. This is helpful for determining which parts of the model to optimise, as the variables consuming the most memory within the tile can be identified.
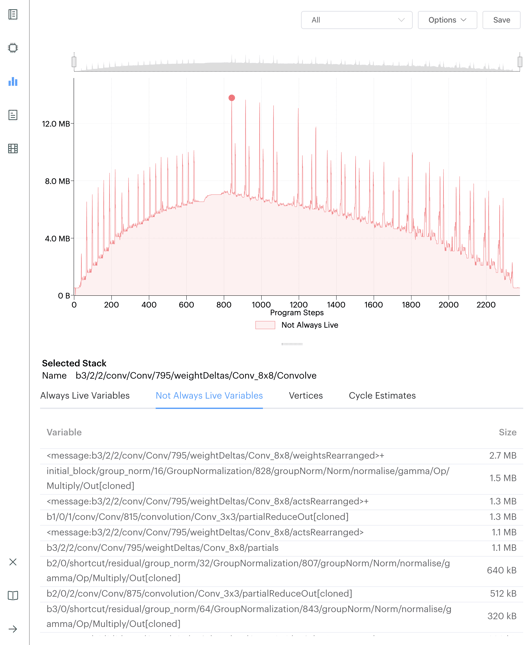
Liveness Report
Liveness is a term used in compilers to describe the use of variables through the lifetime of the program – variables can be either always live or not always live. Always live indicates variables constantly using memory at every step of a program, whereas not always live describes transitory variables.
The Liveness Report is a valuable tool for model optimisation; it can be used to find out which operations or layers in the model require the most memory. In the PopVision Graph Analyser, the Liveness Report’s interactive graph shows how much always live memory and not always live memory is required for each step in the program.
Selecting any program step displays the not always live variables that are active at that point and their size. Liveness can also be viewed for a particular tile. This level of detail on variables is very useful, as memory is not uniformly allocated to all the tiles.
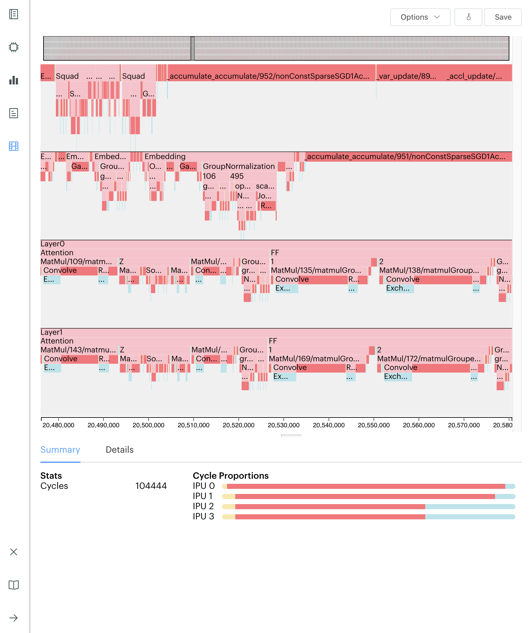
Execution Trace Report
The Execution Trace Report shows the execution of a profiled program in terms of how many cycles it takes each program step to execute. If a user enables profiling when compiling a program, they can collect the profiling information when the program executes.
The report can be viewed either as a series of compute steps or as a flame graph in which program steps that are part of the same operation or layer are grouped together. When a program step or layer is selected, the interactive graph displays how many cycles are in each compute or exchange phase as well as details about each program step.
This report can be used to determine how balanced a large-scale model such as BERT is across multiple IPUs, as it shows each IPU’s activity in parallel and the sync points between each of them.
The example below shows a BERT training model during pipelining.
Extra Features
As well as providing deeper insight into program execution and memory consumption, the PopVision Graph Analyser also comes with additional user-friendly features. These include dark mode and multi-platform support for Windows, Linux and OSX machines.
Reports can be accessed both locally and remotely. When connecting to IPUs via a cloud service such as Microsoft Azure, rather than having to copy large, multi-gigabyte files to a laptop, the PopVision Graph Analyser provides the option to view the file remotely.
Programming with the IPU and Poplar
The PopVision Graph Analyser is being made available to Graphcore customers as part of Poplar release 1.1. The tool contains internal documentation which can answer any FAQs and specialist ongoing support is also available from the Graphcore Field AI Engineering team. Further Poplar SDK documentation released last month can be accessed here.
Share: