Apr 06, 2022
Apr 06, 2022
We're Hiring
Join us and build the next generation AI stack - including silicon, hardware and software - the worldwide standard for AI compute
Join our teamAI Applications Specialists Sreenidhi Anand and Dr Mario Michael Krell have gained a lot of experience using Graphcore’s PopVision analysis tools, and now see them as invaluable tools to have on-hand when optimising model memory and performance.
One of Graphcore’s customers wanted to use the RetinaNet model to perform high-throughput feature detection in video frames. The output of this network would be a set of rectangular bounding boxes around ‘objects of interest’ it had detected in each frame, and it would pass those boxes onwards for further action by other systems.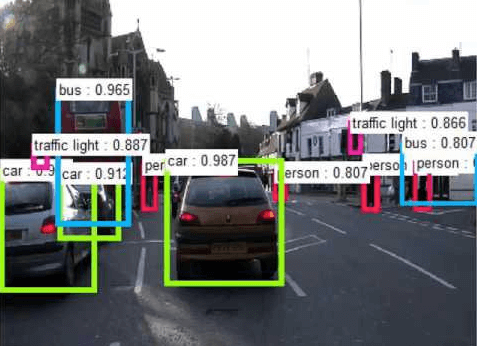
Bounding boxes around detected objects of interest
(sample image captured from Google images)
“We were expecting five to ten boxes per image, but we were getting about 100,000”, said Sreenidhi. “Generally, you would expect there to be 10 to 15 objects”.
100,000 boxes per image was obviously too many to be useful — the detection system would be overloaded with redundant messages — so they added an NMS (Non-Maximum Suppression) filter which would combine those boxes that were identifying the same object. It would then sort them into confidence order so that the downstream systems could make decisions about what actions to take, given the presence of those objects in the field of view.
But this system, as it was, was processing the images far too slowly. To understand why, they opened the PopVision Graph Analyser application and looked at the execution trace that Poplar generates when the model executes.
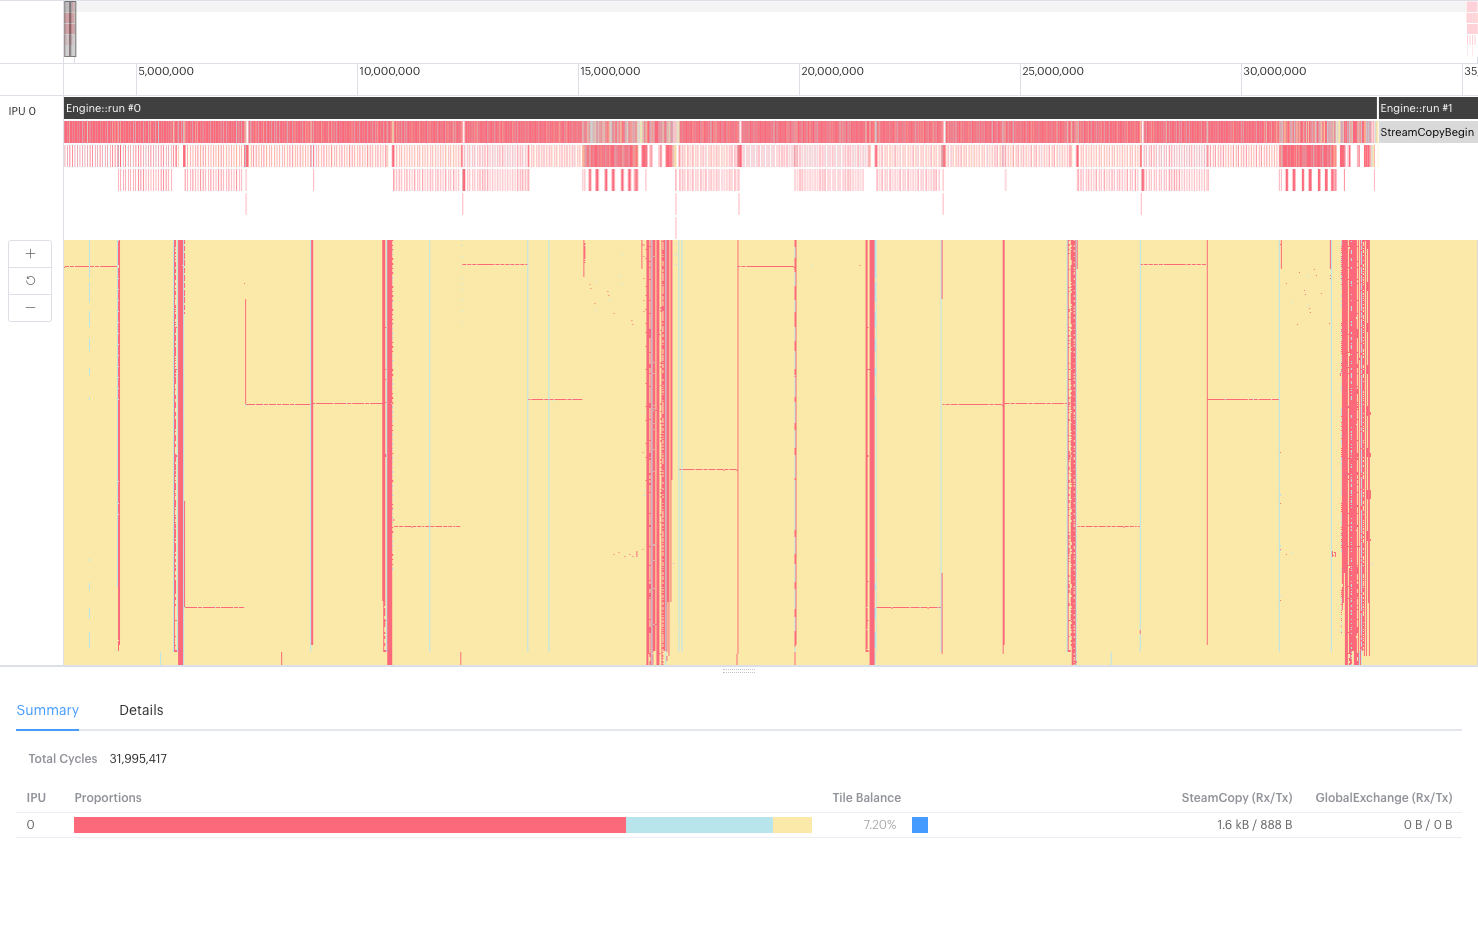 The execution trace report shows the program steps that are executed against IPU clock cycles, and you can use it to determine which functions are taking what proportion of the available cycles. You can even show the activity of each tile on the IPU at any moment.
Most of the trace showed the expected behaviour from the system — all the program steps of the RetinaNet model were there as expected. But it was clear from the BSP trace that most of the IPU activity was taken up with tiles waiting to sync (yellow). When they zoomed in on the sort function of the NMS, it became immediately clear what was causing the bottleneck in the system.
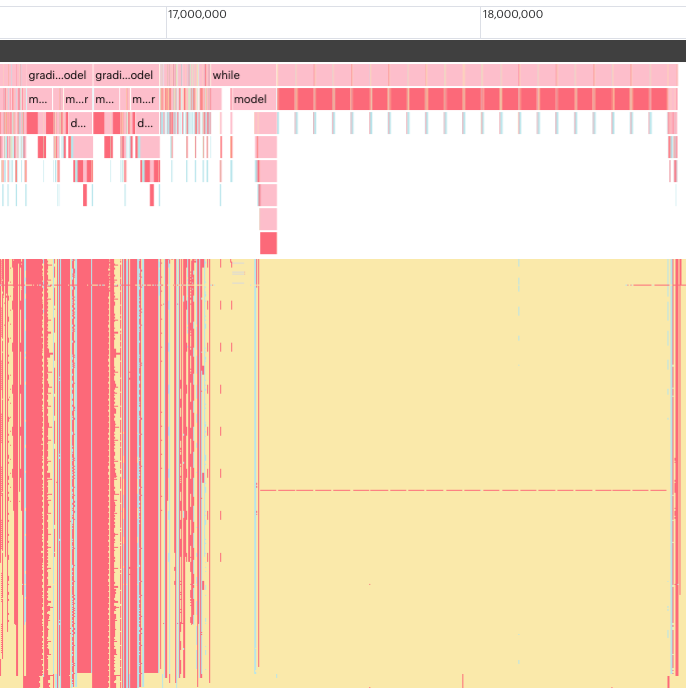
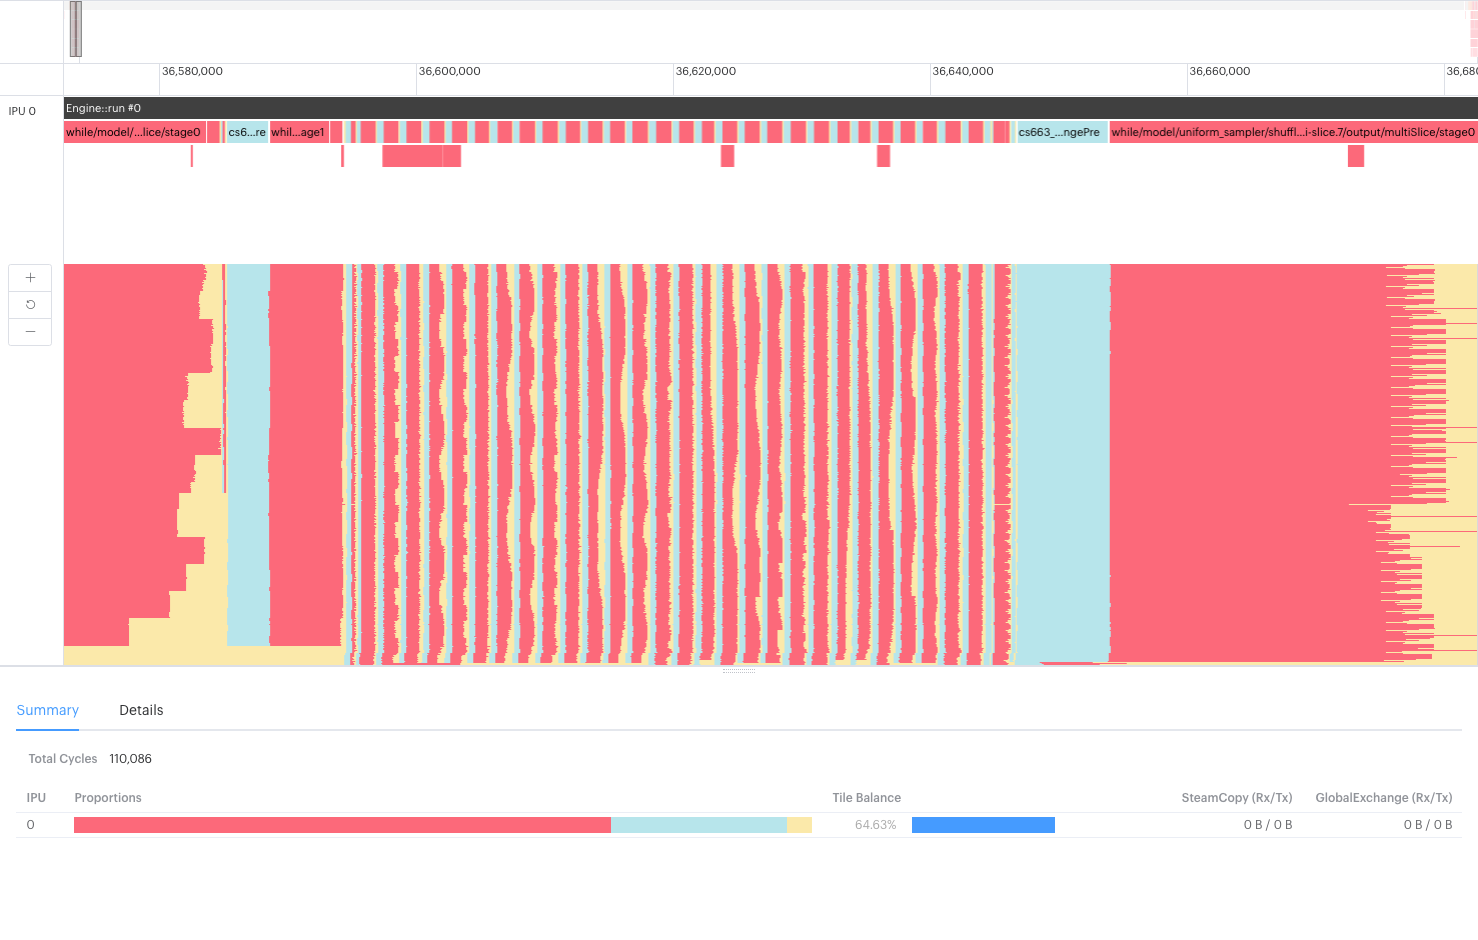
Here, you can see the execution trace of the program that Sreenidhi ran, zoomed in to show an instance of the sorting algorithm at work. The visualization at the top shows a summary of the program execution on the IPU similar to a flame graph. The BSP trace beneath shows the tile activity on the IPU over time, with each tile displayed as a horizontal line (tile 0 at the top).
The IPU operates on a (BSP) Bulk Synchronous Parallel paradigm, which means that at any point, a tile is either computing (pink), waiting to sync with other tiles (yellow), or exchanging data with other tiles (blue). The Poplar software compiles the program steps and allocates them to the available tiles in a manner that best exploits the parallelism of the IPU. To work at the greatest efficiency, the IPU needs to be executing the maximum number of program steps simultaneously, while having the minimum number of tiles waiting to sync with other tiles.
In the image above, you can see the program execution proceeding efficiently across the tiles, but when the sort function is executed (those repeating blocks on the right), nearly every one of the tiles goes into its sync state (yellow), waiting on any executing tiles to finish what they’re doing. And there is a single tile whose BSP trace appears to be red most of the time (indicating it’s computing). All the other tiles are sitting idle, waiting for it to complete its sorting work before they can be used again.
As the sorting algorithm requires many passes of the data before it can pass an ordered list of results onwards, this bottleneck, repeating itself many times during execution, was causing the entire model to execute very much slower than required. This library sort function had originally been designed to use as few tiles as possible, keeping the memory required close-at-hand, but this meant it would only have linear compute efficiency, and often run out of memory trying to complete the final stages of the sort, merging all its sorted blocks.
Sreenidhi set about testing the existing sort function to see why it was taking so long to compile and run on the IPU. He passed it increasingly large batches of numbers to sort: 100, 500, 1,000… and soon found that when he asked his program to sort more than about 5,000 numbers, the compilation took a very long time to complete — the compiler could not find a way to manage the memory such that the search could be scheduled. This seemed unusual — sort functions can be slow and inefficient, but you would always expect them to complete.
PopLibs (and the higher frameworks such as PopART, TensorFlow, etc) all have standard library operations (“ops”), such as matrix multiplication and reduction functions, that are used throughout many model definitions. Most of these functions are very highly optimised for running on the IPU, but sometimes we find ourselves in a situation with a particular application where we need to improve the efficiency of our core code.
Efficient use of memory, high data bandwidth and low latency are all desirable features for machine learning systems. Optimising a model to run well sometimes requires a new custom op to reduce the memory required, or to shave a few milliseconds off the execution time. If other solutions can’t help, a custom op may be called for. (See our guide for creating custom operations here.)
A working group was set up in the Software Team to see which search algorithms might be the most efficient for our existing hardware and software stack, and Software Engineer Jake Hall suggested that a bitonic sort would suit their needs well. There are several variants of this sort, which require many nested compare, swap and merge operations, but it was clear that this kind of algorithm was going to suit the IPU well: as many tiles as possible could be recruited to work in parallel, meaning that no tiles would be left ‘carrying all the load’ and causing the kind of bottleneck they were seeing.
An early experiment with this algorithm, where all the IPU tiles are committed, gave this intriguing image of the BSP activity across tiles:
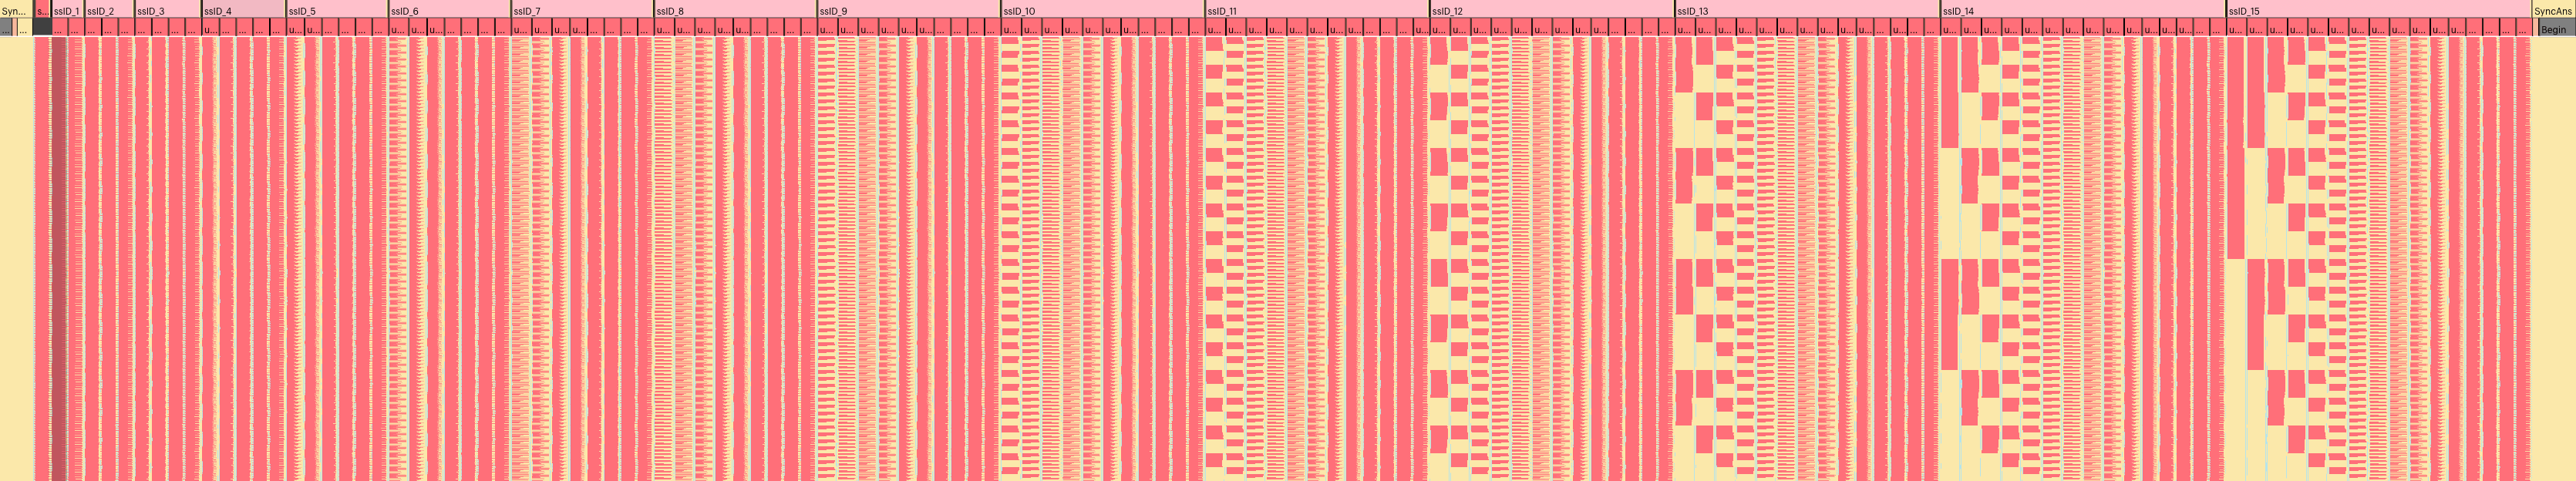
Here you can see that all the tiles on the IPU are being used a great deal more, and none of them is waiting to sync with the others for very long. You can see the periodic pattern of the sort as well, showing the pleasing binary pattern of the individual sorting and merging operations as they gradually bring the sort to completion.
The team soon discovered, however, that a slightly different variant of the bitonic sort would make it run even more efficiently on the IPU, and it was implemented by Software Engineer, Tom Murray. There is always some trade-off when designing a new algorithm, and many metrics must be considered: the speed of the algorithm, the time it takes to exchange data between tiles, and the code size required to implement the algorithm.
In the end, minimising the algorithm’s code size was a major factor in their choice, and they were able to settle on a variation that spread the memory usage and compute load more cleanly amongst the tiles.
When they re-compiled and ran their program with the new custom sorting operation, the compilation time was much quicker, and the throughput and latency were hugely improved. After a few iterations optimising the new sort function, the corresponding part of the execution trace showed a clear improvement in tile efficiency:
 This instance of the sort function, using the new custom op, clearly shows how much more efficiently the parallel tile compute is being used. The load for each tile is well spread amongst the tiles, and none of them is waiting very long to merge its sorted batches with those from other tiles. They all work together, yet independently, to break up the sort into manageable pieces.
This, then, was the solution they needed to give the whole system the performance the customer needed for live video object detection. As the speed of the sort was increased, and the memory was being used more efficiently, they could increase the batch size, giving greater throughput, and lower latency. The number of items that can be sorted is no longer limited with the new operation — you can sort as many items as will fit into the IPU’s memory.
So, a new sort custom operation now exists as part of the standard PopLibs library so that anyone can benefit from it in the future. Just as with the IPU tiles themselves, sharing the work brings real advantages.
As with many ‘breakthrough moments’ that we read about, it’s hard to shake the idea that all the events I’ve described above were a linear, orderly progression of decisions moving gradually towards the goal, but real life is, of course, not so tidy. There is a lot of going back and forth, experimenting, optimising, abandoning and finally finding the most promising path toward success. We can’t always see very far down this path, and our minds aren’t always very receptive to the amount of information that massively complex systems like the IPU can throw at us.
More information about IPU performance isn’t necessarily better, especially if we have no way to understand that data in the context of our problem. Visualising that data, however, leverages expertise that our brains already have. We’re good at understanding images, especially when they combine many data points into single concepts that can be meaningfully represented on-screen.
Because of their long experience building and optimising machine learning models, and using the PopVision analysis tools as an integral part of their investigations, it was possible for Sreenidhi and Mario to see the problem easily, and continue to refine it until the solution ‘looked right’. A good tool should change your view of the world, and allow you to create and build and understand that world in ways that were previously unimaginable.
You can download the latest PopVision tools for MacOS, Linux and Windows here. Our documentation portal also contains guides and tutorials for capturing profiles from your IPU programs.
Share: