Mar 17, 2021
Mar 17, 2021
We're Hiring
Join us and build the next generation AI stack - including silicon, hardware and software - the worldwide standard for AI compute
Join our teamGraphcore has released significant new features for the PopVisionTM family of analysis tools as part of a major Poplar software stack update, Poplar SDK 2.0. We created the PopVision Graph Analyser and System Analyser to help developers maximise the performance of their applications on IPU systems. To mark this update, we are looking at how PopVision tools can be used most effectively to inform and optimise machine learning programs.
With its massively parallel architecture, the IPU has been specifically built from the ground up for machine intelligence workloads and is therefore able to deliver state of the art performance across even the most complex AI models. For this reason, many of our users are usually not just looking to run standard machine intelligence models, but to exploit the highest possible performance from IPU systems, beyond what they have been able to achieve with other systems. For these advanced AI practitioners, our PopVision analysis tools are an invaluable resource to help them optimise their programs and further accelerate their applications.
In traditional GPU SIMD (single instruction, multiple data) architecture-based processors, all processor cores perform the same task at the same time. The IPU, by contrast, is based on a massively parallel MIMD (multiple instruction, multiple data) architecture, so IPU chips and systems follow a Bulk Synchronous Parallel (BSP) schedule – Sync, Compute, Exchange.
This means that tiles on the chip (a tile being an independent processing unit) can perform many different tasks simultaneously in parallel. In some cases, some tiles may be working on more complex tasks and may take longer than others to finish computing, leading to some tiles “waiting” for other tiles to complete their operations.
When model memory is evenly distributed, tiles spend less time waiting to sync since they each have a similar amount of processing to do. Balancing memory distribution also allows models to use larger batch sizes and, combined with recomputation, significantly increases performance.
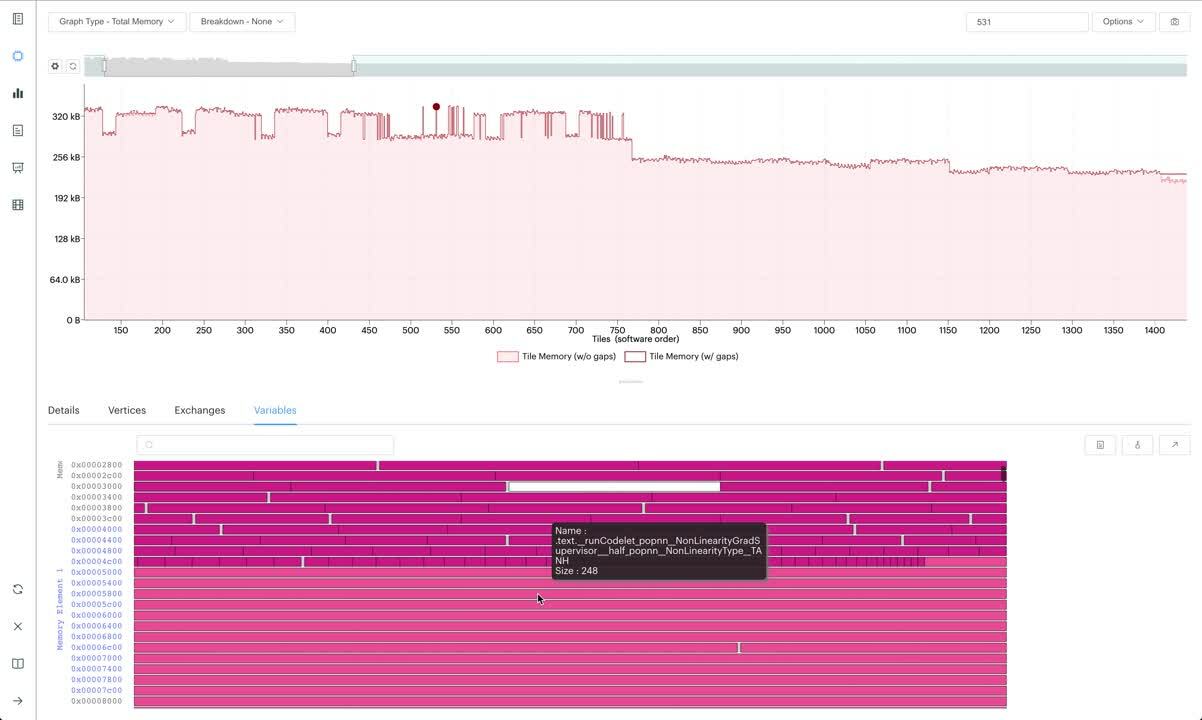
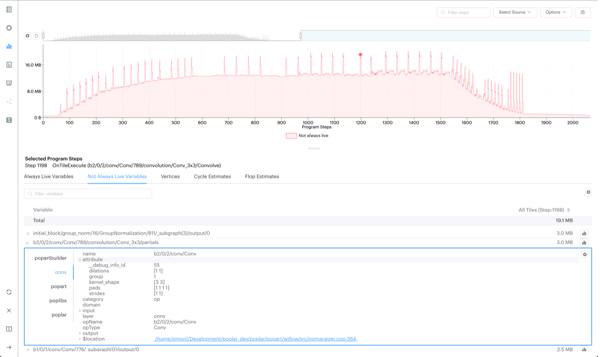
The Memory Report contains various interactive visualisations allowing developers to view memory per IPU tile or memory per IPU processor and see further details on vertices, exchanges and variables.
A new table view for memory variables makes it easier to quickly identify variables which use excessive memory. The table shows a list of variables in ascending or descending order, and if a developer selects multiple tiles, these tiles can be viewed and compared. This is particularly useful when developers are looking at two very similar models and trying to determine why one performs much better than the other. By using the report comparison feature in PopVision and this new memory variables table view, an IPU developer can quickly review which variables are most memory-intensive and understand which optimisations may be useful to balance out these memory peaks.
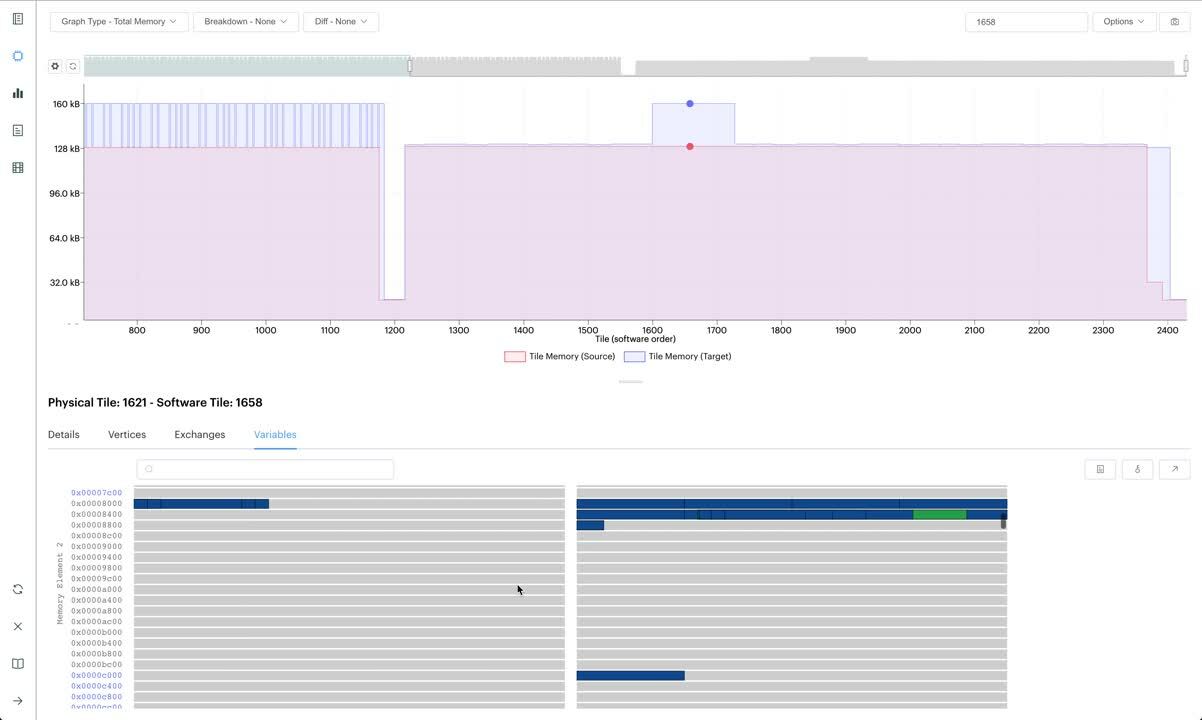
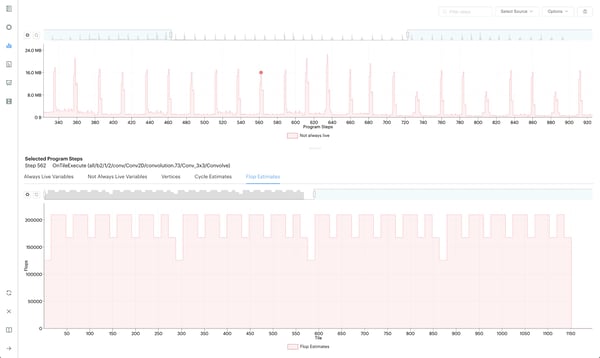
The PopVision Graph Analyser also includes a Liveness Report to show temporary peaks in memory, providing even more insights into where most memory is being used in a model to aid optimisation.
The Liveness Report now has an option to select multiple points on the liveness graph to compare variables between program steps. Developers programming on the IPU can find the start and end of an operation in program steps and see the increase or decrease in liveness between these two points. This enables a better understanding of what is happening at a variable level during a specified peak in memory utilisation.
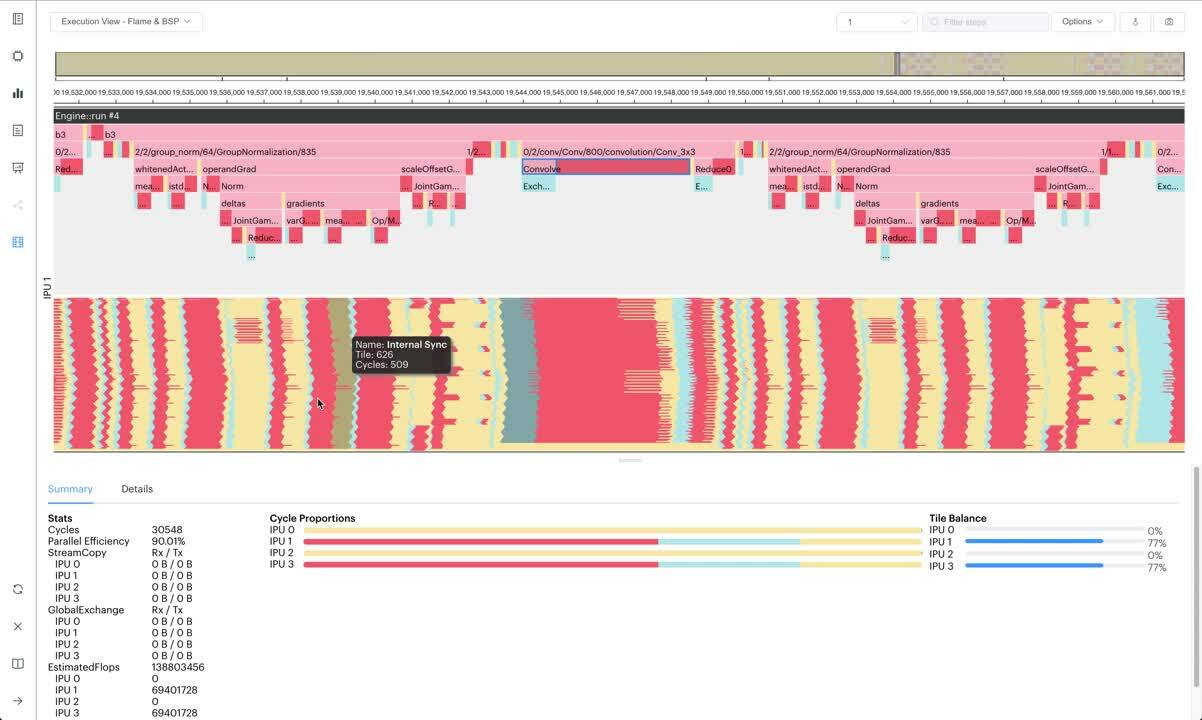
Using the PopVision Execution Trace Report for guidance, operations can be balanced so that IPU tiles and IPUs are utilised more efficiently with minimal time spent waiting to sync.
The Execution Trace Report is used to help balance operations distributed over multiple IPUs and shows the cycle count for each step in the program, detailing statistics, tile balance, cycle proportions and compute-set details.
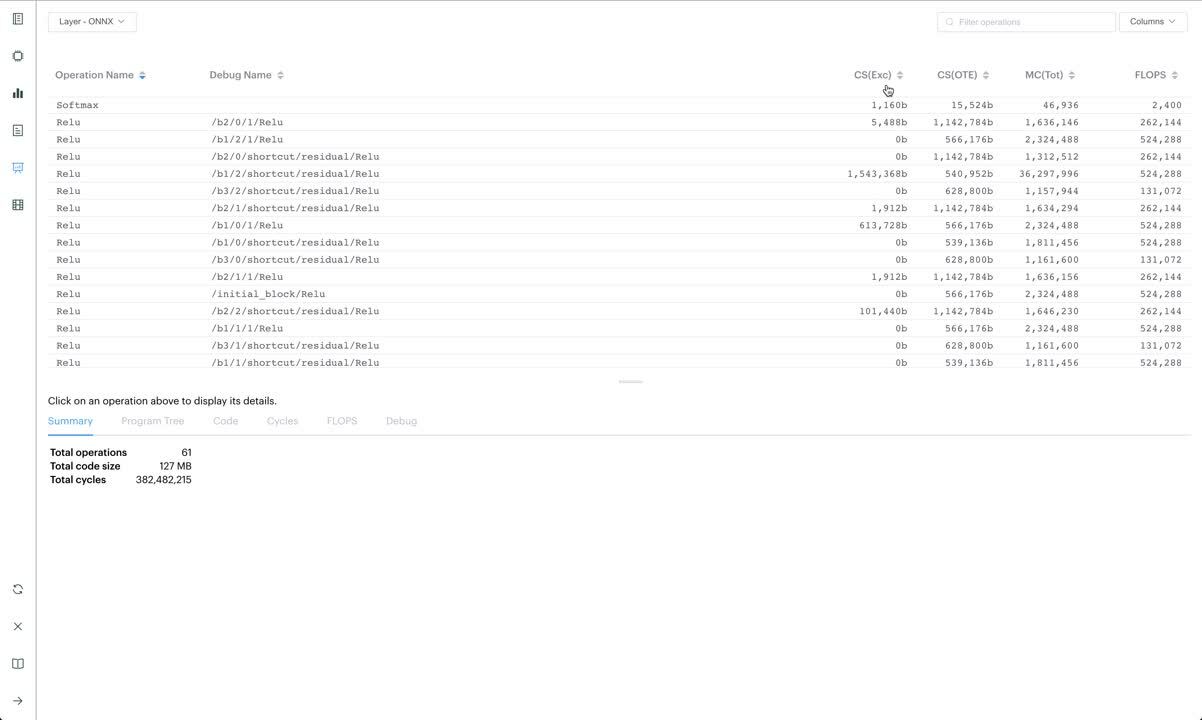
The latest PopVision release includes the number of floating point operations required for each layer in a network, and for the network as a whole. The floating point operation counts are based on the Poplar implementations of the ops involved. These counts are useful for developers to establish the throughput they can expect of their models on the IPU. For example, the model's total floating point operations can be used to establish the rate of outputs per second of a high-throughput inference application.
To have Poplar report the estimated number of floating point operations, developers will need to set the poplar engine option profiler.includeFlopEstimates.
In the last release, we added enhanced debug information for Poplar and PopLibs that can be viewed in the Graph Analyser. The enhanced debug information allows developers to understand which PopLibs API call has created a variable or a compute set on the IPU and see the parameters which were passed to the PopLibs API.
For this release, we have extended the enhanced debug information to TensorFlow and PopART. Developers can now see details of the TensorFlow or PopART operation that creates a variable of a compute set.
Using the enhanced debug information, we have created a new Operation Summary Report. This new report allows developers to see information summarised at layers of the application, for instance, the total floating point operations for an individual convolution in their model or the total number of cycles for a matmul. Developers can see which parts of their model are the most costly and should be optimised.
In addition to all the new visual features added to the PopVision Graph Analyser we have working on improving the underlying file format that we save the profile information in. The Poplar SDK 2.0 will now by default use a new file format which means developers can capture longer executions and the PopVision Graph Analyser will load them faster. We are also including in the Poplar SDK a preview release of a new PopVision Analysis library which allows programmatic analysis of the profile information. More information can be found in Poplar SDK release documentation.
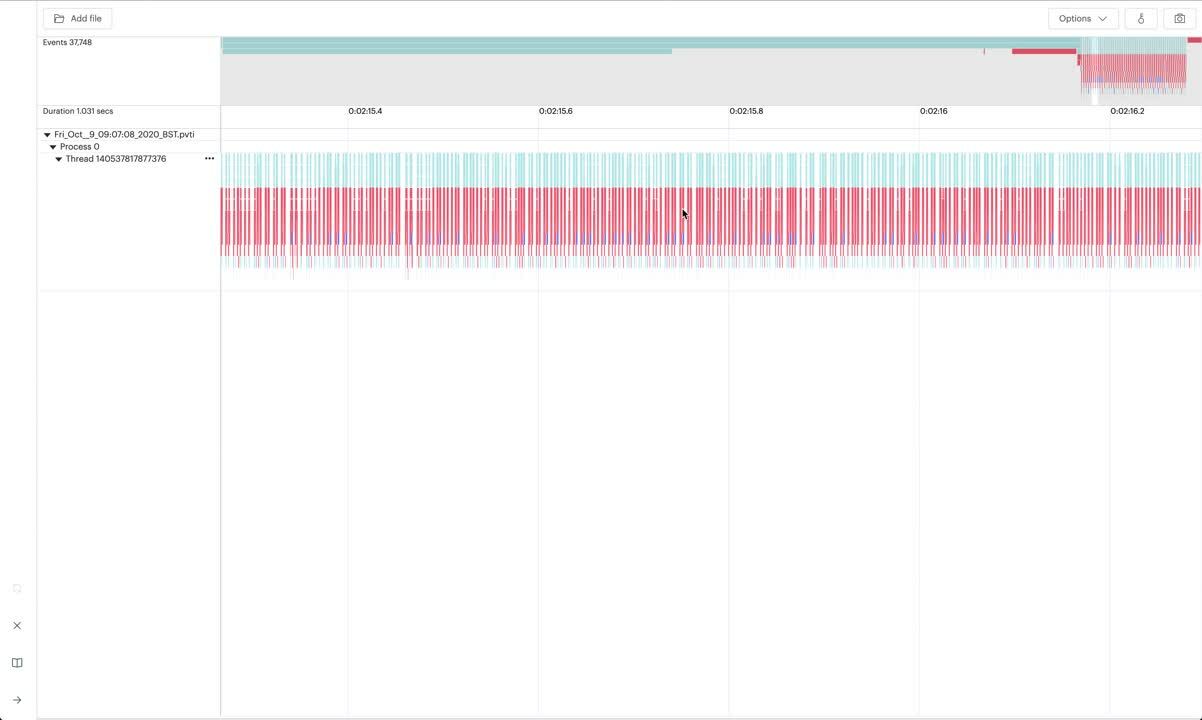
The PopVision System Analyser allows developers to identify bottlenecks on the host CPU by visualising the profiling information collected by the PopVision Trace Instrumentation library of Poplar, frameworks and the user application.
For machine learning models where large datasets need to be fed to the IPU system from the host, it can be extremely useful to understand which latencies the host system is introducing.
In this release, the System Analyser can open profile reports on a remote host over SSH, in the same way as the Graph Analyser; this was one of the most requested features after the first release of the System Analyser in 2020.
The PopVision System Analyser was created to help developers understand how their application scales when they use different IPU-POD systems. When testing with these systems, we found that they use many threads for the preparation of data for each iteration. To help developers to better understand these profiles, we have added options to collapse and expand individual threads.
A new call tree view has been added to the PopVision System Analyser. Developers can now look at bottlenecks in the execution of their application on the CPU and review the total time and self time of each profiled function (excluding time spent in child functions). This level of detail helps determine which parts of the application take the longest to execute and identify areas for optimisation.
Developers can also instrument their own applications with the PopVision trace instrumentation library (PVTI) and see their application profile in the System Analyser. For instance, developers can instrument the high-level epoch loop as described in the PopVision instrumentation tutorial on GitHub.
By using the System Analyser and the new call tree view, IPU developers can identify when the CPU is introducing extra latency. If they find that this is connected to the CPU processing their dataset, they can look to optimise their dataset loading.
For example, when running computer vision models where image datasets need to be delivered from the CPU host to an IPU system, the work done on the CPU can impact overall performance. This is particularly true in cases where the image file size is particularly large (such as a set of chest X-ray scans) or if a high throughput rate is required.
The PopVision Graph Analyser and System Analyser are visual, interactive analysis tools which can be used effectively by Graphcore developers to analyse application performance on IPU systems. For more information on PopVision tools, read the PopVision User Guide.
Our Developer Portal is regularly updated with new content for IPU programmers, including documentation, tutorials, videos and application examples. For tailored guidance, users can reach out to Graphcore on our Support platform and review application code and programming tutorials on GitHub.
Share: